
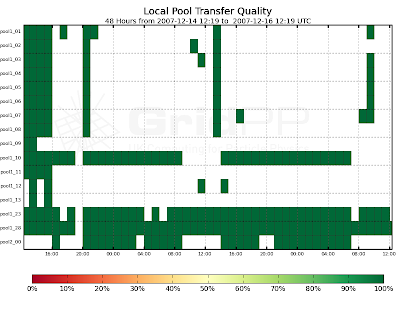
The above plots come from some new dCache monitoring that I have set up to study the behaviour of the Edinburgh production storage (srm.epcc.ed.ac.uk). This uses Brian Bockleman's GraphTool and some associated scripts to query the dCache billing database. You can find the full set of plots here (I know, it's a strange hostname for a monitoring, but it's all that was available):
http://wn3.epcc.ed.ac.uk/billing/xml/
GraphTool is written in python and uses matplotlib to generate the plots. Cherrypy is used for the web interface. The monitoring can't just be installed as an rpm: you need to have PostGreSQL 8.2 available; create a new view in the billing database; set up Apache mod_rewrite; ensure you have the correct compilers installed..., but these steps shouldn't be a problem for anyone.
I think you will agree that the monitoring presents some really useful views of what the dCache is actually doing. It's still a work in progress, but let me know when you want to set it up and I should be able to help.
It should be possible to do something similar for DPM in the coming weeks.


