Showing posts with label monitoring. Show all posts

01 April 2014

Dell OpenManage for disk servers

As we've been telling everyone who'll listen, we at Oxford are big fans of the Dell 12-bay disk servers for grid storage (previously R510 units, now R720xd ones). A few people have now bought them and asked about monitoring them.

Dell's tools all go by the general 'OpenManage' branding, which covers a great range of things, including various general purpose GUI tools. However, for the disk servers, we generally go for a minimal command-line install.

Dell have the necessary bits available in a YUM-able repository as described on the Dell Linux wiki. Our setup simple involves:
  • Installing the repository file,
  • yum install srvadmin-storageservices srvadmin-omcommon,
  • service dataeng start
  • and finally logging out and back in again, or otherwise picking up the PATH variable change from the newly installed srvadmin-path.sh script in /etc/profile.d
At that point, you should be able to query the state of your array with the 'omreport' tool, for example:
# omreport storage vdisk controller=0
List of Virtual Disks on Controller PERC H710P Mini (Embedded)

Controller PERC H710P Mini (Embedded)
ID                            : 0
Status                        : Ok
Name                          : VDos
State                         : Ready
Hot Spare Policy violated     : Not Assigned
Encrypted                     : No
Layout                        : RAID-6
Size                          : 100.00 GB (107374182400 bytes)
Associated Fluid Cache State  : Not Applicable
Device Name                   : /dev/sda
Bus Protocol                  : SATA
Media                         : HDD
Read Policy                   : Adaptive Read Ahead
Write Policy                  : Write Back
Cache Policy                  : Not Applicable
Stripe Element Size           : 64 KB
Disk Cache Policy             : Enabled
We also have a rough and ready Nagios plugin which simply checks that each physical disk reports as 'OK' and 'Online' and complains if anything else is reported.

27 February 2013

ss a tool to debug sockets

In the effort to explain why a 1M default buffer size works better than the more canonic 87k set also by the system and suggested in every network optimization site, as I wrote in this post about sonar tests to BNL, I tried the ss command suggested by John Green. Below are two results with 87k and 1M default buffer size respectively there are two things that jump to the eye for me

1) cwnd doesn't go beyond 30 in the first test, while in the second test cwnd is at least 556 and up to 1783. In my wikipedia knowledge of how this all really works it means the TCP window is not scaling with the first settings and it is with the second.

2) the memory field is completely different in the first case we have bytes in memory in some state in one (more often two streams, sometimes three) and nothing else. In the second case we have memory fields equally filled. This mirrors what observed with netstat and the Send-Q field.

Different state of the connection might report additional fields. For example when the connection is in CLOSE_WAIT state an ato (ack timeout) parameter appears. Also in CLOSE_WAIT the memory is fields are different r and f are uniformly filled instead of w and f.


Which confirms that with the fasterdata settings the TCP window doesn't scale (at least beyond a very small value such as 30).

Some interesting links I found to explain the fields

mem r,w,f,t values
cwnd or slow start and congestion control
wscale value
rto retransmission timeout

87k settings

ss -timeo|grep -A1 192.12.15.235|grep -v 192.12
mem:(r0,w0,f0,t0) ts sack htcp wscale:7,9 rto:292 rtt:92/0.75 cwnd:31 send 3.9Mbps rcv_space:14600
mem:(r0,w0,f0,t0) ts sack htcp wscale:7,9 rto:292 rtt:92/0.75 cwnd:30 send 3.8Mbps rcv_space:14600
mem:(r0,w0,f0,t0) ts sack htcp wscale:7,9 rto:307 rtt:104.125/0.75 cwnd:30 send 3.3Mbps rcv_space:14600
mem:(r0,w106648,f73576,t0) ts sack htcp wscale:7,9 rto:307 rtt:104/0.75 cwnd:21 send 2.3Mbps rcv_space:14600
mem:(r0,w0,f0,t0) ts sack htcp wscale:7,9 rto:307 rtt:104.125/0.75 cwnd:30 send 3.3Mbps rcv_space:14600
mem:(r0,w0,f0,t0) ts sack htcp wscale:7,9 rto:307 rtt:104/0.75 cwnd:30 send 3.3Mbps rcv_space:14600
mem:(r0,w0,f0,t0) ts sack htcp wscale:7,9 rto:292 rtt:92.125/0.75 cwnd:29 send 3.6Mbps rcv_space:14600
mem:(r0,w0,f0,t0) ts sack htcp wscale:7,9 rto:291 rtt:91.875/0.75 cwnd:30 send 3.8Mbps rcv_space:14600
mem:(r0,w0,f0,t0) ts sack htcp wscale:7,9 rto:292 rtt:92/0.75 cwnd:28 send 3.5Mbps rcv_space:14600

1MB settings

ss -timeo|grep -A1 192.12.15.226|grep -v 192.12
     mem:(r0,w1620945,f267311,t0) ts sack htcp wscale:9,8 rto:312 rtt:112.5/26 cwnd:621 send 63.9Mbps rcv_space:14600
     mem:(r0,w5074901,f213035,t0) ts sack htcp wscale:9,8 rto:320 rtt:120.5/34.5 cwnd:638 send 61.3Mbps rcv_space:14600
     mem:(r0,w269841,f495,t0) ts sack htcp wscale:9,8 rto:333 rtt:130.625/18 cwnd:356 send 31.6Mbps rcv_space:14600
     mem:(r0,w269841,f495,t0) ts sack htcp wscale:9,8 rto:319 rtt:119.5/18.75 cwnd:345 send 33.4Mbps rcv_space:14600
     mem:(r0,w2944464,f266800,t0) ts sack htcp wscale:9,8 rto:317 rtt:117.125/34.5 cwnd:1236 send 122.2Mbps rcv_space:14600
     mem:(r0,w269841,f495,t0) ts sack htcp wscale:9,8 rto:319 rtt:119.75/18.75 cwnd:320 send 31.0Mbps rcv_space:14600
     mem:(r0,w5621967,f239409,t0) ts sack htcp wscale:9,8 rto:313 rtt:113.125/24.25 cwnd:624 send 63.9Mbps rcv_space:14600
     mem:(r0,w269841,f495,t0) ts sack htcp wscale:9,8 rto:322 rtt:122.25/17.25 cwnd:318 send 30.1Mbps rcv_space:14600
     mem:(r0,w2943432,f800312,t0) ts sack htcp wscale:9,8 rto:314 rtt:114.375/21.75 cwnd:655 send 66.3Mbps rcv_space:14600


Connections in different states (additional fields)


ss -timeo|grep -A1 192.12.15
ESTAB      0      1587665     195.194.108.50:43684        192.12.15.233:41628    timer:(on,299ms,0) uid:19536 ino:20107501 sk:ffff88010b09cb00
     mem:(r0,w1620945,f267311,t0) ts sack htcp wscale:9,8 rto:312 rtt:112.5/26 cwnd:621 send 63.9Mbps rcv_space:14600
[...]

ss -timeo|grep -A1 192.12.15
CLOSE-WAIT 1      0          195.194.108.50:43684        192.12.15.233:41628    uid:19536 ino:20107501 sk:ffff88010b09cb00
     mem:(r4352,w0,f3840,t0) ts sack htcp wscale:9,8 rto:300 rtt:100.5/9 ato:40 cwnd:1924 send 221.8Mbps rcv_space:14600
[....]
 

20 August 2009

GridPP DPM toolkit v2.5.2 released

Hello all,

Another month, another toolkit release.
This one, relative to the last announced release (2.5.0) has a slightly improved functionality for dpm-sql-list-hotfiles and adds a -o (or --ordered) option to dpm-list-disk.
The -o option returns a sorted list of the files in the space selected, descending by filesize. As this uses the dpm API, the process currently needs to pull the entire filelist before sorting it, so, unlike the normal mode, you get all the files output in one go (after a pause of some minutes while all the records are acquired + sorted).

There's also a new release of the Gridpp-DPM-monitor package, which includes some bug fixes and the new user-level accounting plot functionality. This should work fine, but if anyone has any problems, contact me as normal.

All rpms at the usual place:
http://www.sysadmin.hep.ac.uk/rpms/fabric-management/RPMS.storage/

24 October 2008

Monitoring space token ACLs


I have extended my space token monitoring to pick up the ACLs (technically the GlueVOInfoAccessControlBaseRule) about each space token that is published in the information system fro each site, SE and VO. This is updated each day and you can see the table of results here. The point of this is to make it easier (i.e. no horrible ldapsearch'ing) to check the deployment status of the tokens and the ability of certain VOMs roles to write files into them. Of course, this assumes that the advertised permissions do in fact match those on the SE, which in turn relies on the GIPs being correct. YMMV.

16 October 2008

GridppDpmMonitor v0.0.4 released


I've made another release of GridppDpmMonitor. This adds support for viewing the space used per user (i.e. DPM virtual uid) and per group (DPM virtual gid). I've removed most of the DN information so that user privacy is retained.

You'll have to wait until tomorrow for the yum repository to be rebuilt. See previous postings on this subject to get the location of the wiki and repo.

The monitoring will be useful to see which users are exceeding their "quota", but it does not enforce a quota on the users. At the moment, there is no quotaing in the Grid SEs. However, this tool does give site admins is the ability to go and beat local users round the head with a big stick if they go over their allocation. CMS want 1TB for local users; I don't think there is a similar requirement from ATLAS, yet.

09 October 2008

New release of GridppDpmMonitor


I've made a new release of the GridppDpmMonitor. This adds a new plot which shows you the breakdown of failures according to the error message that is stored by DPM (annoyingly, this is often blank). I have also modified the existing graphs such that the client DN's are not shown (I got into trouble for this). Instead, I just show the common name (CN) of the DN, which is much more acceptable.

You can go to the usual place for instructions.

02 June 2008

GridppDpmMonitor


People often state that DPM is a bit of a black box. That it, they know it's working, but aren't really sure what it is doing or who is using it. To help address this problem, over the past week or so I've put together some some DPM monitoring to help visualise all of the information which is usually locked in the MySQL database. Hopefully, this will give sites an idea of what DPM is doing and make it easier to debug problems with data access.

The system works using GraphTool (I've mentioned this numerous times before) and is heavily influenced by Brian Bockleman's dCache monitoring tool. I have constructed a variety of queries which pull information directly from the DPM MySQL database about transfer requests. The monitoring is basically a set of python scripts and xml files. To ease installation and help resolve the dependencies, I've packaged (again, thanks Brian) the monitoring up into an rpm called GridppDpmMonitor and hosted it in the HEPiX sys-man yum repository. Instructions for configuration are here, along with some example plots.

I'm still working out exactly what plots we want to see and constructing the appropriate SQL queries. It's a beta (i.e. not perfect) release but I would appreciate any comments you have. The system is already running at Edinburgh, Durham and Cambridge (thanks Phil and Santanu!).

You should note that getting a transfer rate plot doesn't actually appear to be possible. If anyone can work out a way of doing it from the dpm_db tables then let me know. Also, having this monitoring linked into Nagios would be great, but that is something for the future.

As always, contributions are welcome!

04 March 2008

Visualising FTS transfers


As always, monitoring is a hot topic. Sites, experiments and operations people all want to know what Grid services are doing and how this is impacting on their work. In particular, it is clear from todays GDB that monitoring of the FTS is important. The above graph shows the output of a script which I have put together over the past day which queries the RAL FTS service for information about its channels, their transfer rates and information about the number of jobs that are scheduled to be transferred. In fact, I don't query the FTS directly, but use some CGI that Matt Hodges at RAL set up (thanks Matt!). It's a prototype at the moment, but I think it could be one useful way of looking at the data and getting an overview of the state of transfers.

You can see the latest plots for the WLCG VOs here. They are updated hourly. I still need to play about with the colours to try and improve the visual effect. It would be great if the line thickness could be varied with transfer rate, but I don't think GraphViz/pydot can do that.

23 January 2008

Banned by SAM

Looks like the SAM people weren't very happy with the monitoring that I was running to summarise the status of storage resources on the Grid. In fact, they were so unhappy that they decided to block the IP address that I was using and switch off access to the /sqldb/ query path on their server! As such, the monitoring hasn't been working for the past few days.

I'll admit that I was putting a fair bit of load on their database since I was using a multithreaded application to request information about 6 different tests for ~200 SEs over the past 30 days, but I think this is a bit harsh. Another part of the problem is that the script seemed to trip up when processing information on a couple of sites (and it was always the same sites), leading to it continually requesting the same information. I'd love to debug why this was, but this is somewhat difficult when I can't access the DB.

I'm currently jumping through some hoops to try and get access to the new JSP endpoint. Hopefully this will be granted soon and I can update the application to deal with the new XML schema.

16 January 2008

Monitoring SRM2.2 deployment

Using a combination of the WLCG information system, srmPing from the StoRM SRM client, a multithreaded python script, GraphTool and Apache, I've set up some daily monitoring of all of the SRM v2.2 endpoints that are available on the Grid. This will help track deployment of the new software, allowing us to see which versions are running in production.

http://wn3.epcc.ed.ac.uk/srm/xml/

Using the cool GraphTool features, you can drill down into the data by typing dCache, CASTOR or DPM in the SRM_flavour box. You can also look at a particular countries endpoints by putting something like .uk in the endpoint box (for all UK sites). Hopefully poor old wn3.epcc can handle all this monitoring that it's doing!

One thing to note is that there is quite a variety of dCache 1.8.0-X out there. What are the developers playing at?

A slightly annoying feature is that srmPing requires a valid proxy, so I'll need to come up with a good way of creating a long-lived one.

Global dCache monitoring


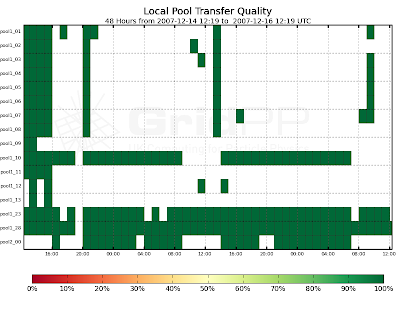
It's been a while since my last post - been busy with some things that I will post about shortly. As you know, I've been running the GridPP SAM storage monitoring for the past few weeks. It looks like the dCache team got wind of this and have asked if I could set up something similar to summarise the SAM test results for all dCache sites in the WLCG information system. This is now done and the results can be seen above and at this new page in the dCache wiki:

http://trac.dcache.org/trac.cgi/wiki/MonitoringDcache

I don't seem to be able to get SAM results for the US Tier-2 sites, so I'll need to investigate this. The above link contains other useful information that I'll talk about shortly.

03 January 2008

dCache PostgreSQL monitoring


Happy New Year everyone!

Following a recommendation from the dCache developers, I set up some PostGreSQL monitoring using pgFouine. It is very simple to install and configure. The plots are generated automatically by the pgfouine tool in addition to giving a full breakdown of what queries took the longest time. This should be useful to let you understand what your database (and hence dCache) is doing. You can also use it to analyse the output of the VACUUM (FULL) ANALYSE command which should give you an idea as to how large the FSM should be set to (which is an important configuration parameter).

PS Fouine is French for stone marten, which is something like a weasel.

16 December 2007

Anyone for some dCache monitoring?


The above plots come from some new dCache monitoring that I have set up to study the behaviour of the Edinburgh production storage (srm.epcc.ed.ac.uk). This uses Brian Bockleman's GraphTool and some associated scripts to query the dCache billing database. You can find the full set of plots here (I know, it's a strange hostname for a monitoring, but it's all that was available):

http://wn3.epcc.ed.ac.uk/billing/xml/

GraphTool is written in python and uses matplotlib to generate the plots. Cherrypy is used for the web interface. The monitoring can't just be installed as an rpm: you need to have PostGreSQL 8.2 available; create a new view in the billing database; set up Apache mod_rewrite; ensure you have the correct compilers installed..., but these steps shouldn't be a problem for anyone.

I think you will agree that the monitoring presents some really useful views of what the dCache is actually doing. It's still a work in progress, but let me know when you want to set it up and I should be able to help.

It should be possible to do something similar for DPM in the coming weeks.